What’s the average house price in a school’s catchment area?
In order to calculate the average house price in a school’s catchment area,
we are going to use PostGIS and OpenStreetMap. We’ll need to know the price and location of houses sold in that area, and the location of the schools and it’s catchment area. The former can be determined from the land registry and although this does not provide any geocoding we can do this using data provided by OpenStreetMap’s Nominatim. The location of the schools can be found in OpenStreetMap’s polygon table.
In this example we are using MYTOWN and SCHOOL NAME as aliases.
OpenStreetMap
There are good instructions on how to setup OpenStreetMap here and I recommend following these.
Postcodes
For the postcode data, first get the data:
wget https://www.nominatim.org/data/gb_postcode_data.sql.gz
gunzip gb_postcode_data.sql.gz
Create a PostGIS table for the postcode data noting that it uses the EPSG:4326 projection.
CREATE TABLE gb_postcode (
    id integer,
    postcode character varying(9),
    geometry geometry,
    CONSTRAINT enforce_dims_geometry CHECK ((st_ndims(geometry) = 2)),
    CONSTRAINT enforce_srid_geometry CHECK ((st_srid(geometry) = 4326))
);
Then ingest the data as follows:
psql -dgis -f data/gb_postcode_data.sqlHouse prices.
UK house prices are recorded by the Land Registry and they have a nice SPARQL console interface http://landregistry.data.gov.uk/app/qonsole. Here we get the house prices for properties in MYTOWN in 2018 using the following SPARQL query:
prefix rdf: <http://www.w3.org/1999/02/22-rdf-syntax-ns#>
prefix rdfs: <http://www.w3.org/2000/01/rdf-schema#>
prefix owl: <http://www.w3.org/2002/07/owl#>
prefix xsd: <http://www.w3.org/2001/XMLSchema#>
prefix sr: <http://data.ordnancesurvey.co.uk/ontology/spatialrelations/>
prefix ukhpi: <http://landregistry.data.gov.uk/def/ukhpi/>
prefix lrppi: <http://landregistry.data.gov.uk/def/ppi/>
prefix skos: <http://www.w3.org/2004/02/skos/core#>
prefix lrcommon: <http://landregistry.data.gov.uk/def/common/>

SELECT ?paon ?saon ?street ?town ?county ?postcode ?amount ?date ?category
WHERE
{
  VALUES ?town {"MYTOWN"^^xsd:string}
FILTER (
    ?date > "2018-01-01"^^xsd:date &&
    ?date < "2018-12-31"^^xsd:date
  )
  ?addr lrcommon:town ?town.

  ?transx lrppi:propertyAddress ?addr ;
          lrppi:pricePaid ?amount ;
          lrppi:transactionDate ?date ;
          lrppi:transactionCategory/skos:prefLabel ?category.

  OPTIONAL {?addr lrcommon:county ?county}
  OPTIONAL {?addr lrcommon:paon ?paon}
  OPTIONAL {?addr lrcommon:saon ?saon}
  OPTIONAL {?addr lrcommon:street ?street}
  OPTIONAL {?addr lrcommon:postcode ?postcode}

}
ORDER BY ?amount
To get the housing data into PostGIS we first create a table for the house prices, the copy the data from a csv, and finally copy the appropriate postcode geometry onto the house table. This is a bit of a shortcut cut to make subsequent lookups easier as we could have made a foreign key relation between the house and postcode tables.
CREATE TABLE house (
    postcode character varying(9),
    geometry geometry,
    paon varchar(40),
    saon  varchar(40),
    street varchar(40),
    town varchar(40),
    county varchar(40),
    postcode varchar(11)
    amount integer,
    date date,
    category varchar(40)
);
Copy the postcode geometry onto the house table
UPDATE house
SET geometry=gb_postcode.geometry
FROM gb_postcode WHERE gb_postcode.postcode LIKE house.postcode;
The final thing to do is to transform the data to transform the postcode table to have the same projection as the OpenStreetMap tables.
ALTER TABLE house
ALTER COLUMN geometry TYPE geometry(point, 3857)
USING ST_Transform(ST_SETSRID(geometry,4326),3857);
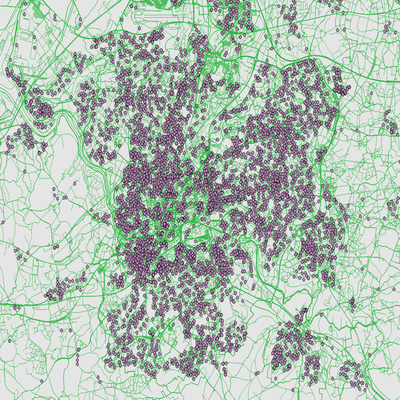
In QGIS we can plot the houses sold in MYTOWN in the 2018:

Filtering sold houses around a school
Now we have OpenStreetMap and a table of houses we can find the houses within a distance of a school. The schools location is found from the planet_osm_polygon table and it is easy enough as SELECT ST_CENTROID(way) FROM planet_osm_polygon WHERE name ILIKE '%SCHOOL NAME'. This query finds the polygon representing the school (note you may need to add an extra clause amenity LIKE 'school') and the PostGIS function ST_CENTROID finds the centre of the polygon. The filter we need to apply to the house table is `WHERE ST_DWITHIN(POINT1, POINT2, DISTANCE) where POINT1 is the centre of the scool, POINT2 is the point of the house (geometry field on the house table) and DISTANCE is the permitted distance in metres. In the following example, I have chose 800m as this was the radius of the catchment area in 2018.
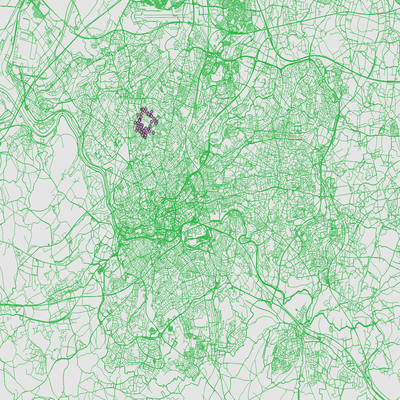
Again using QGIS we can apply then following filter to the house table we find the houses sold within a 800m radius of the school.
WHERE ST_DWITHIN(
    (
        SELECT ST_CENTROID(way)
        FROM planet_osm_polygon
        WHERE name ILIKE '%SCHOOL NAME%'
    ),
    geometry,
    800
);
Finally we are in a position to calculate the average house price.
SELECT min(h.amount), avg(h.amount), max(h.amount)
FROM house as h
WHERE ST_DWITHIN(
    (
        SELECT ST_CENTROID(way)
        FROM planet_osm_polygon
        WHERE name ILIKE '%SCHOOL NAME%'
    ),
    h.geometry,
    800
);gis=# SELECT MIN(h.amount), AVG(h.amount), MAX(h.amount)
FROM house h
LEFT JOIN planet_osm_polygon pa ON ST_DWITHIN(ST_CENTROID(pa.way), h.geometry, 800)
WHERE pa.name ILIKE '%SCHOOL NAME%';
min | avg | max
--------+---------------------+--------
220000 | 581765.051724137931 | 988200
(1 row)
Time: 641.007 ms
gis=# SELECT MIN(h.amount), AVG(h.amount), MAX(h.amount)
FROM house as h
WHERE ST_Dwithin(
(SELECT ST_CENTROID(way) FROM planet_osm_polygon WHERE name ILIKE '%SCHOOL NAME%'),
h.geometry,
800
);
min | avg | max
--------+---------------------+--------
220000 | 581765.051724137931 | 988200
(1 row)
Time: 644.310 ms